FFmpegDebug
How to debug
The small program uses the mac machine. First complete the preparation of FFmpeg source code download and compilation.
(0)Download FFmpeg source code–success
git clone git://source.ffmpeg.org/ffmpeg.git ffmpeg
As for the tools used to open these source files, readers should consider tools that are suitable for them and suitable for large projects, such as sourceinsight, sublime, vim, emacs, xcode, Android Studio, etc.
(1) Compile FFmpeg–success
#实际操作的命令
brew install yasm
brew install automake fdk-aac git lame libass libtool libvorbis libvpx \
opus sdl shtool texi2html theora wget x264 x265 xvid nasm

./configure --disable-optimizations --enable-debug
make
Compilation to use the compiler, the easiest way to install xcode on the mac machine is to ensure that the compiler clang is there.
For debugging, this compilation can be very simple, just remove the optimization option, then make:
make clean ./configure –disable-optimizations make
Configure is a configuration script provided by FFmpeg to generate Makefile and config.h files. Makefile is used at compile time, and config.h (the definition of various macros inside) is used by FFmpeg source code, which also affects the function clipping of FFmpeg.
For configure parameters, readers can also view all options via ./configure –help and then find options for optimization.
The make clean here is to clear the previous compilation pollution. If it has not been compiled before, it does not need to be executed.
In addition, if you execute make install after make, you will install FFmpeg to the mac system. This is not necessary for debugging, just make a binary library.
After successful compilation, you can see these files:

(2) Debug FFmpeg with gdb
For readers who prefer to use the command line, using gdb or lldb for debugging is a good choice.
Before using gdb, you need to install and sign gdb. If the reader is not ready for gdb and is interested in using gdb, you can read the contents of the split line. This also includes the commands commonly used by gdb.
Install gdb:
brew install homebrew/dupes/gdb
Authorize gdb, refer to:https://blog.csdn.net/cairo123/article/details/52054280
Write a test example:
touch gdbtest.c: int main() { int a = 10; printf("%d\n"); }
Compile:
gcc -o gdbtest gdbtest.c -g
Note that you must bring -g to generate the symbol dSYM file.
Then you can debug it. Common commands have these:
Gdb gdbtest – load the executable r –run, run, can take parameters i b –info break, breakpoint information b 3 –break 3, breakpoint on line 3 b main –main function breaks the first line b other_c:fun1 – the breakpoint of the first line of the fun1 function of the file other_c b 120 – breakpoints at 120 lines clear – delete all breakpoints d 3 –delete 3, delete breakpoint 3 disable 1 – disable breakpoint 1 enable 1 – enable breakpoint 1 s –step, jump in f –finish, jump out n –next, execute one line n 3 –next 3, execute 3 lines c –continue, continue until the next breakpoint or end p a –print a, output the value of the variable a list/l – view the code q/kill – Exit this debug bt – view the call stack return – return the current function
For convenience, the small program directly uses FFmpeg’s program to cut into debugging (of course, you can also write your own code to call FFmpeg), for example, you can choose ffplay_g this program to cut in, debug the basis on which it depends, FFmpeg.
Debugging ffplay_g requires input parameters. After gdb ffplay_g, r “xxx/file.mp3” can be used to play ffplay_g to play this file.
Here’s a demo video of a small snippet using gdb for simple debugging:

Need to pay attention, with _g is a program with debugging information, that is needed for debugging.
(3) Debug FFmpeg with xcode–success
Obviously, using gdb for debugging is not too intuitive for reading code or operations. In this case, readers can consider using xcode to debug FFmpeg.
Xiao Cheng does not introduce each configuration link here, because readers can refer to the following illustrated article, step by step: 使用Xcode断点调试ffmpeg
At this point, I have already explained how to debug FFmpeg.
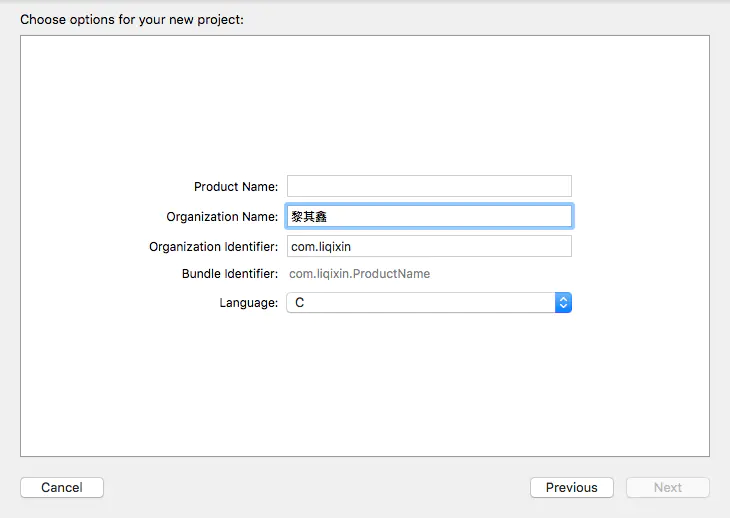
- 创建Xcode新项目
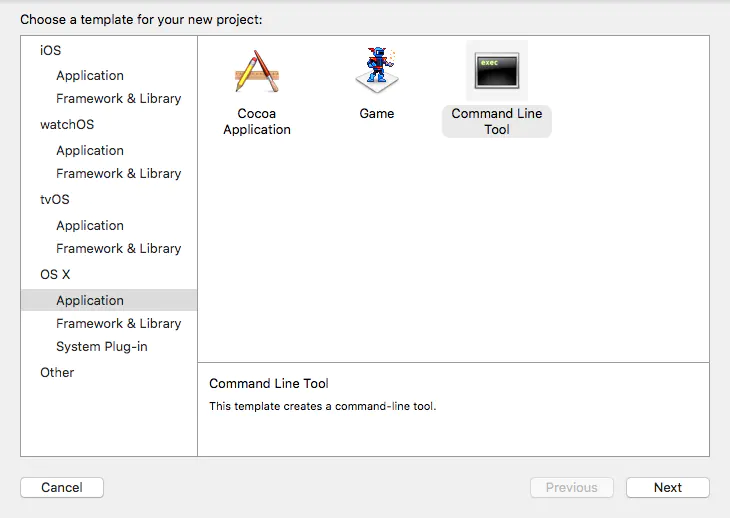
这里选择Command Line Tool
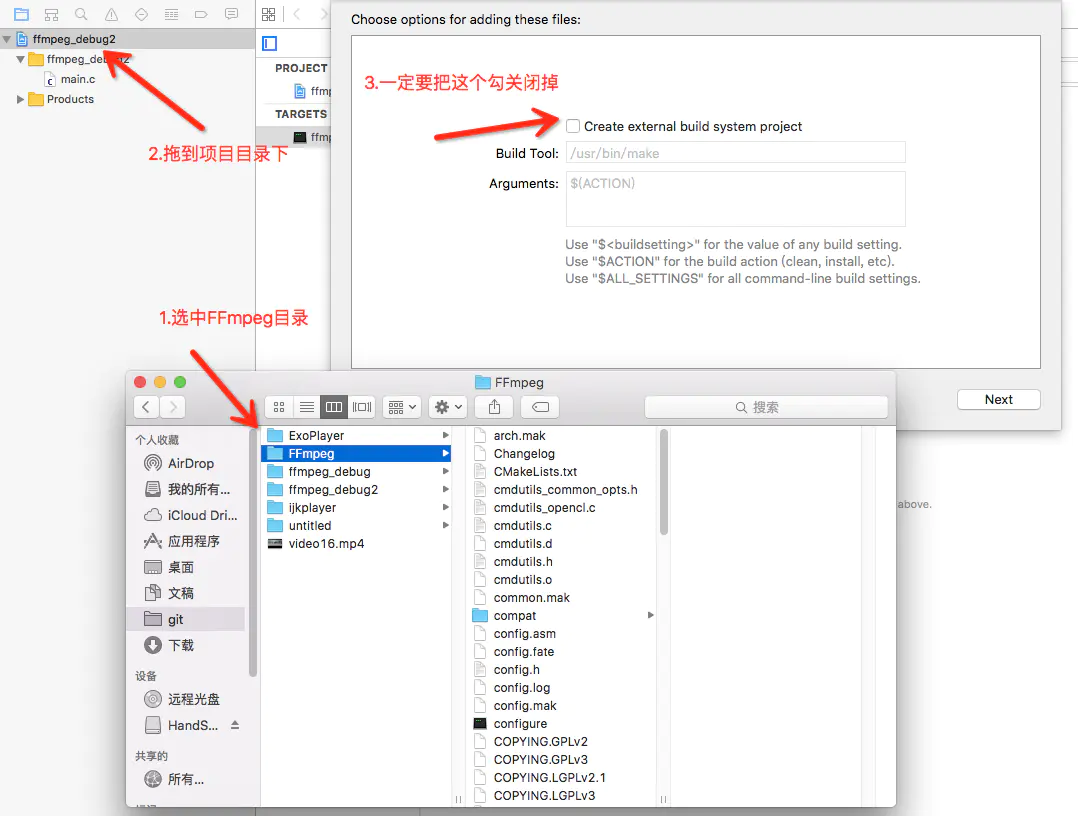
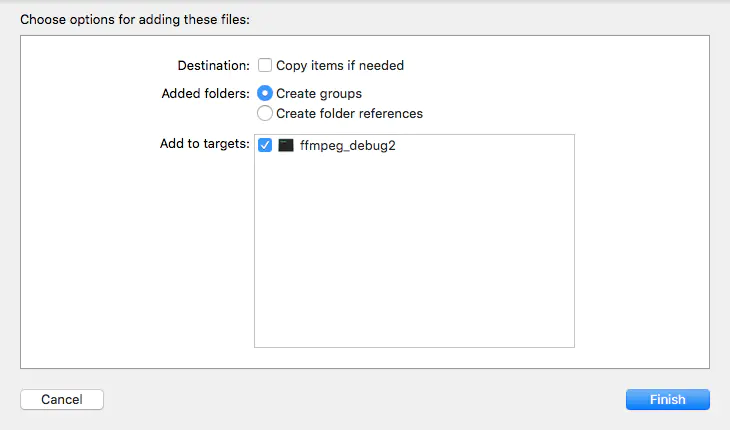
4 . 引用FFmpeg
5 .添加linked 信息(图中少了一个/)
首先添加Header Search Paths
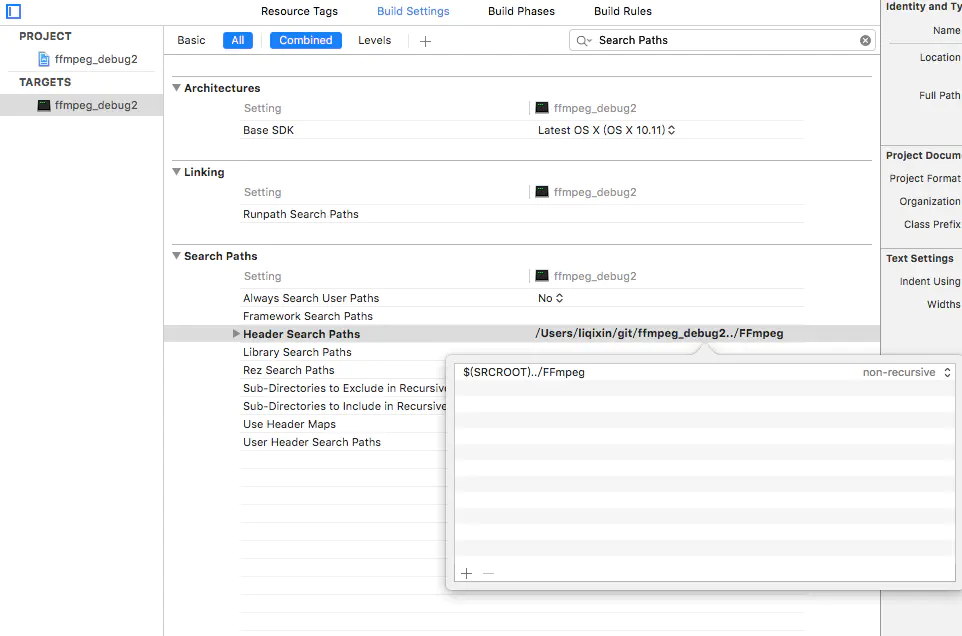
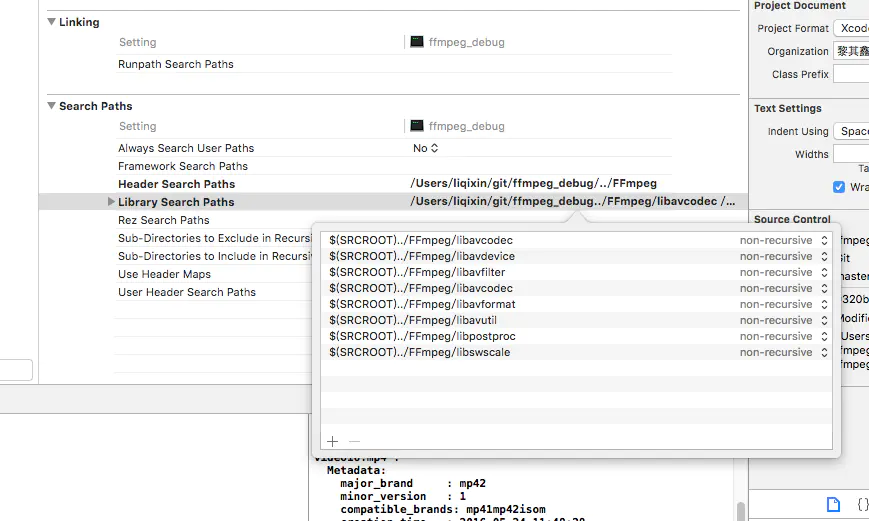
接着添加Library Search Paths
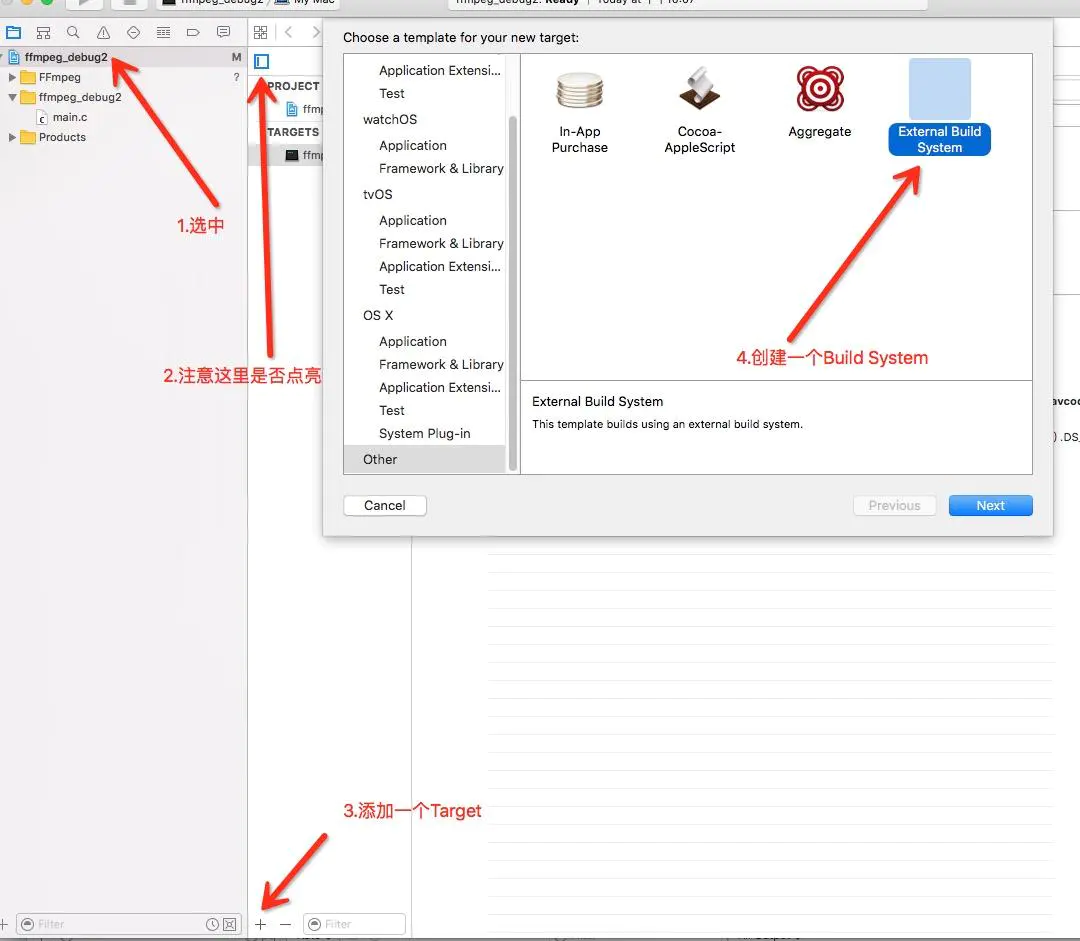
6 .添加target
添加文件夹路径
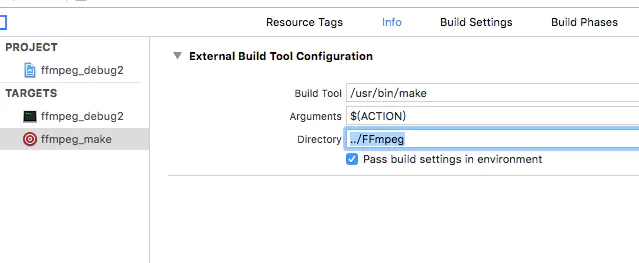
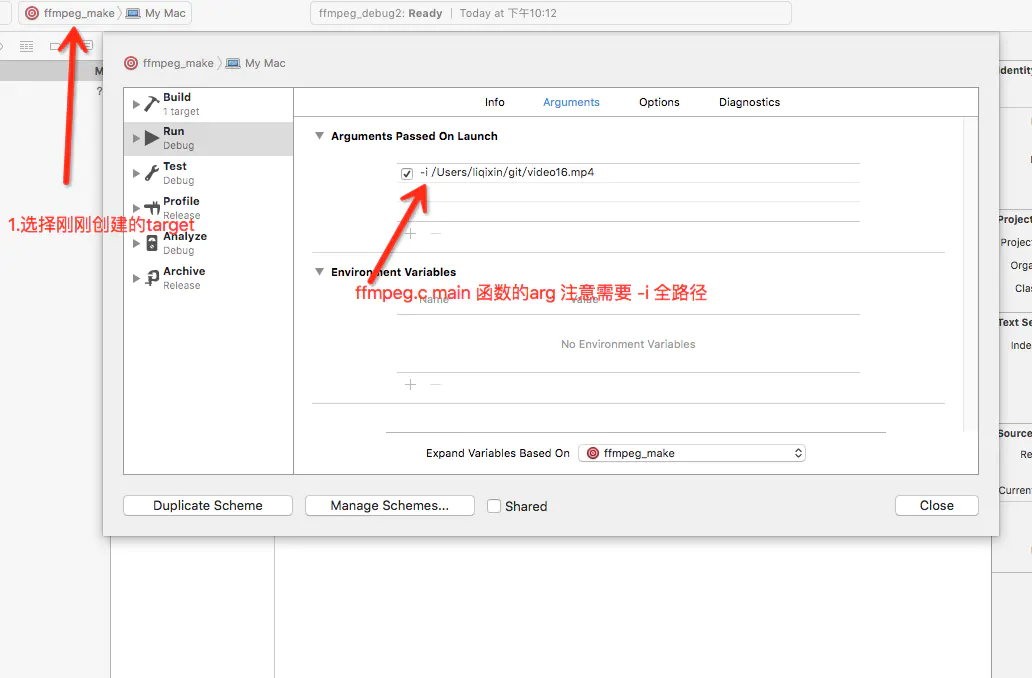
配置ffmpeg_make运行信息
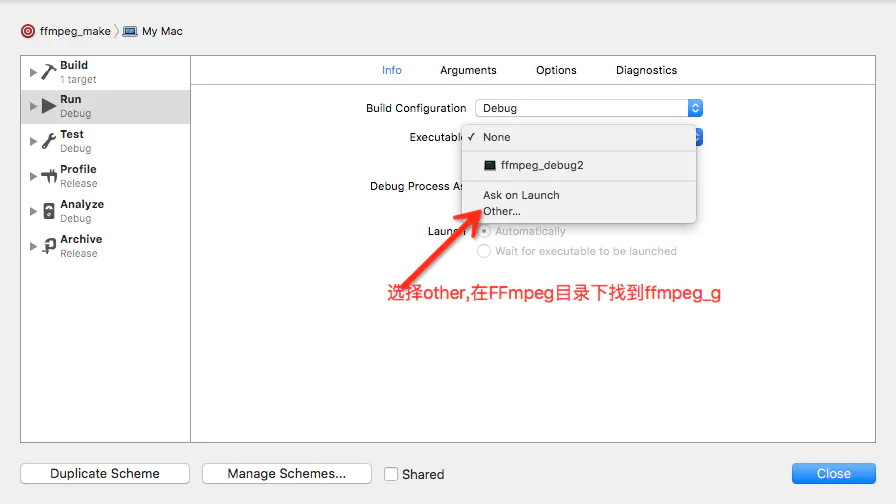
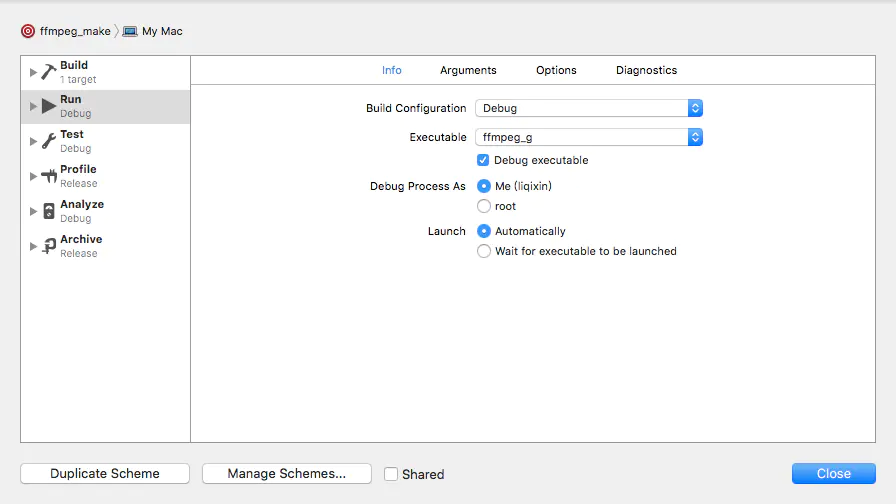
配置executable
最后结果是这样的
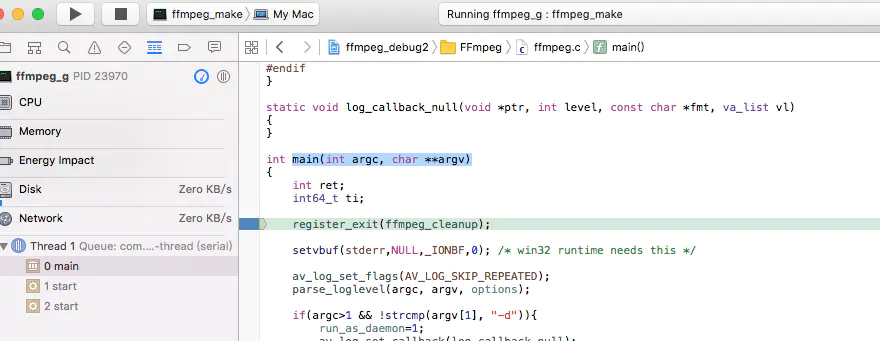
7 .大功告成 现在到ffmpeg.c main函数打个断点试试
To sum up, this article describes how to debug FFmpeg source code on macos, including using gdb or xcode to debug, and also how to compile FFmpeg with debugging information.
Debug examples(transcoding)
qianpianpian@zhenghuanMacbookPro ffmpeg % make examples
- Library Search Paths添加:
$(SRCROOT)/../ffmpeg/doc/examples
- Add Target:
Info–>External Build Tool Configuration–>Directory:../ffmpeg/doc/examples
- Edit New Target:
Arguments:
/Users/qianpianpian/git/demo/FFmpegDebug/FFmpegDebug/video_480x360_mp4_h264_1350kbps_30fps_aac_stereo_192kbps_44100hz.mp4 /Users/qianpianpian/git/demo/FFmpegDebug/FFmpegDebug/output.avi
Info–>Executable选中doc/examples/transcoding_g
- add breakPoint and Run Debug
运行时遇到如下错误待处理:
Error: cannot create compression session: -12903
Try -allow_sw 1. The hardware encoder may be busy, or not supported.
对应源码
//videotoolboxenc.c
static int vtenc_create_encoder(AVCodecContext   *avctx,
                                CMVideoCodecType codec_type,
                                CFStringRef      profile_level,
                                CFNumberRef      gamma_level,
                                CFDictionaryRef  enc_info,
                                CFDictionaryRef  pixel_buffer_info,
                                VTCompressionSessionRef *session)
{
    VTEncContext *vtctx = avctx->priv_data;
    SInt32       bit_rate = avctx->bit_rate;
    ....
    int status = VTCompressionSessionCreate(kCFAllocatorDefault,
                                            avctx->width,
                                            avctx->height,
                                            codec_type,
                                            enc_info,
                                            pixel_buffer_info,
                                            kCFAllocatorDefault,
                                            vtenc_output_callback,
                                            avctx,
                                            session);

    if (status || !vtctx->session) {
        av_log(avctx, AV_LOG_ERROR, "Error: cannot create compression session: %d\n", status);

#if !TARGET_OS_IPHONE
        if (!vtctx->allow_sw) {
            av_log(avctx, AV_LOG_ERROR, "Try -allow_sw 1. The hardware encoder may be busy, or not supported.\n");
        }
#endif

        return AVERROR_EXTERNAL;
    }
./configure –disable-optimizations –enable-debug –disable-videotoolbox会导致找不到encoder
./configure –disable-optimizations –enable-debug –disable-videotoolbox –enable-gpl –enable-libx264能够正常调试(视频长度是音频长度的两倍)
解决方案参考:
> However, having done that, libAVCodec appears to be failing when it calls > through to the OSX VideoToolbox.framework. > > [h264_videotoolbox @ 0x106806800]
This (not the error message) indicates that libavcodec was compiled without support for libx264, recompile with –enable-libx264 (after installing libx264)
I had problem too with videotoolbox encoder, and I didn’t figure how to make it work, so I built a version of ffmpeg without videotoolbox and with libx264, to be sure libx264 was used as default encoder for h264.
Here is my configuration options if interested:
export MACOSX_DEPLOYMENT_TARGET=10.8
./configure –disable-videotoolbox –disable-audiotoolbox –enable-libx264 –enable-libfdk-aac –enable-nonfree –enable-gpl –sysroot=/Users/gabry/MacOSX10.8.sdk/
… this removes also a lot of OSX frameworks dependencies (you have to configure/compile/install libfdk-aac and libx264 before compiling ffmpeg)
参考
https://trac.ffmpeg.org/wiki/CompilationGuide
https://stackoverflow.com/questions/9211163/debugging-ffmpeg